
Analyze 15,000+ assets for free
Buy Your Favorite Stocks Before They Recover.
Look up any of 15,000+ assets and instantly see how often drops this deep happened before, how far they fell, and how long recovery took. Alerts watch 132 large, long-listed tickers with 20+ years of history.
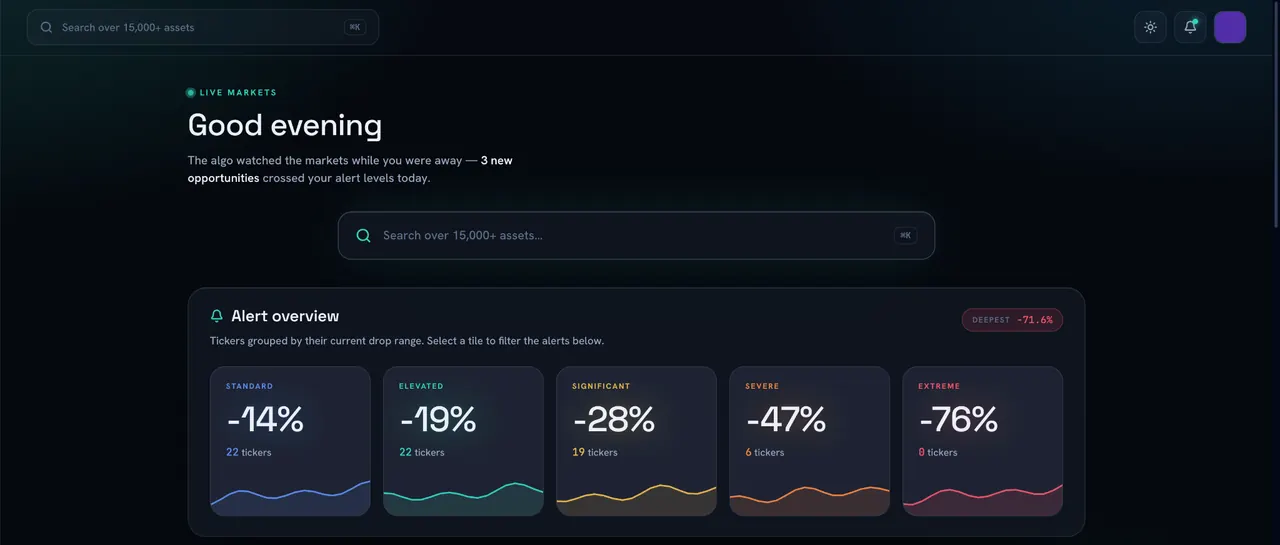
NFLX is down 48%. This has happened only 5 times before in 24 years.
Nexa puts today’s move beside every comparable historical drawdown so you can immediately see frequency, recovery time and what happened next.
Netflix, as of the Oct 9, 2026 close. Refreshed after each US market close.
See the full NFLX analysis →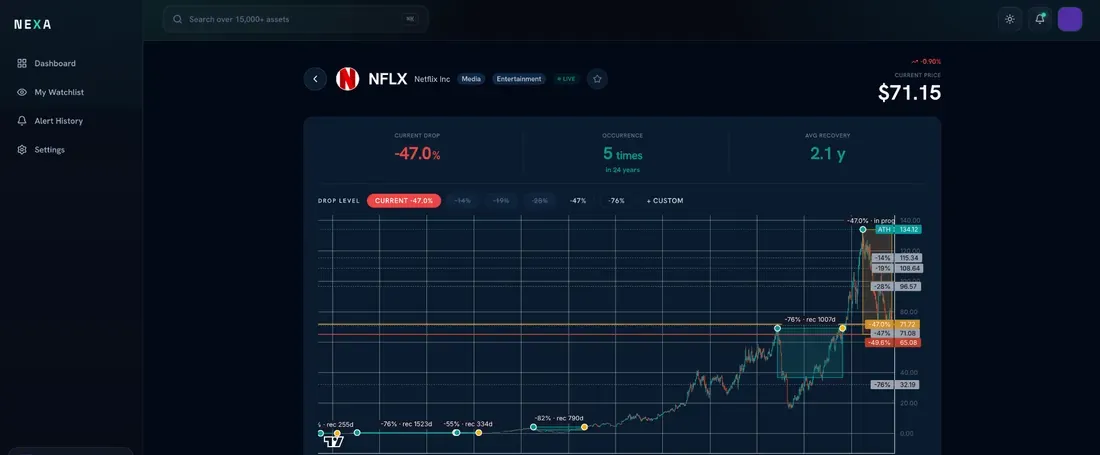
App screenshot of the NFLX analysis, taken on an earlier day.
Know the drop at a glance.
Nexa turns years of drawdown history into one fast read.
Historical research only. Not a prediction or investment recommendation.
Stop searching for opportunities. Let them come to you.
Every 30 minutes Nexa checks 132 large, long-listed tickers and surfaces the ones crossing historically meaningful drawdown levels.
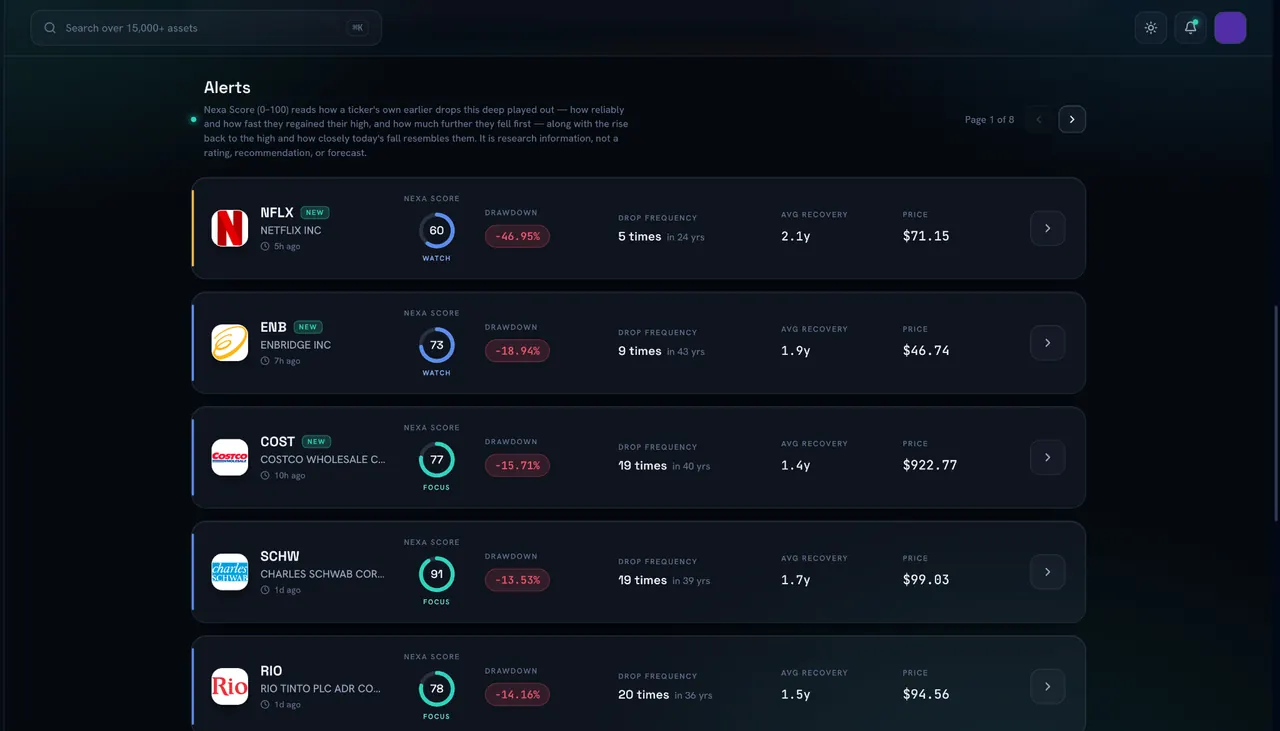
App screenshot, taken on an earlier day.
From market move to clarity in seconds.
Nexa detects the drop
A stock crosses one of Nexa’s drop levels (−14% to −76%).
History is checked
Nexa finds every comparable decline and recovery.
Context gets scored
Frequency, speed, downside and similarity are summarized.
You investigate
Decide what deserves deeper research before the market moves on.
Not every dip is worth your attention.
Nexa separates everyday pullbacks from historically unusual events, from standard declines to extreme drawdowns.
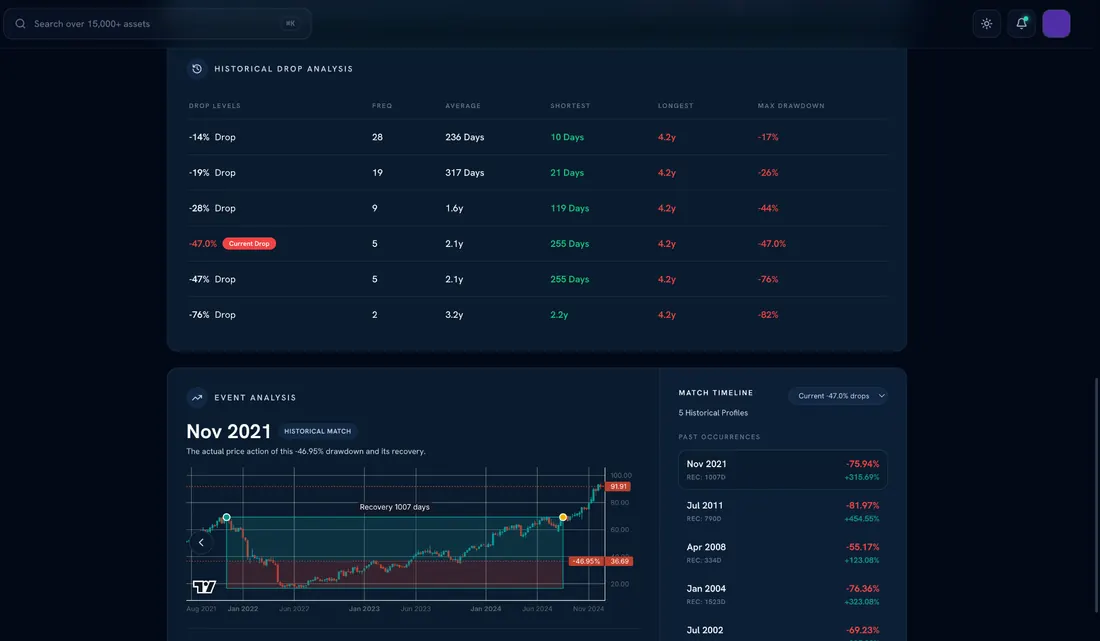
Start finding rare drops today.
Everything you need to discover, understand and monitor historically unusual stock declines.
- Analysis of 15,000+ assets
- Historical drawdown analysis
- Nexa Score
- Up to 2 alerts a week
- Watchlists
- Alerts dashboard
Pro Max is coming soon: join the waitlist to hear first.
Questions, answered.
Does Nexa tell me what to buy?
No. Nexa organizes historical drawdown data so you can decide what deserves further research. It does not provide personalized investment advice.
What does the Nexa Score mean?
It summarizes how a stock’s own earlier drops this deep behaved, using recovery reliability, recovery speed, further downside, upside to the prior high and similarity measures.
Which stocks does Nexa cover?
You can analyze any of 15,000+ assets. Alerts are narrower on purpose: every 30 minutes Nexa checks 132 tickers with 20+ years of history, 128 large companies (a few in two share classes, like Alphabet’s GOOGL and GOOG) and the S&P 500 ETF, because a drop is only “historically rare” when there are decades of history to compare it with.
What’s free?
Creating an account is free and needs no credit card. It includes the full analysis for any stock, the Nexa Score, watchlists and up to 2 alerts a week. Pro is $139/month and adds a 1-on-1 call with the founder every quarter. Pro Max is coming soon: join the waitlist to hear when it opens.
The next major drop won’t send you an invitation. Nexa will.
See what just dropped, how rare it is, and what happened before.